 Weather24
Barometric pressure today: right now in the US
Right now in New York the barometric pressure is 29.96 inHg (1014 hPa): normal, falling over the last 3 hours (−0.05 inHg). This time yesterday: 30.19 inHg; tomorrow the model expects 29.86 inHg.
| City | Now | Level | 3 h | 24 h | Tomorrow |
|---|---|---|---|---|---|
| New York | 29.96 inHg · 1014 hPa | normal | ↓ −0.05 | −0.23 | 29.86 |
| Los Angeles | 29.93 inHg · 1014 hPa | normal | → +0.02 | ±0.00 | 30.00 |
| Chicago | 29.71 inHg · 1006 hPa | low | → −0.01 | −0.01 | 30.03 |
| Houston | 29.91 inHg · 1013 hPa | normal | → ±0.00 | −0.04 | 29.97 |
| Phoenix | 29.89 inHg · 1012 hPa | normal | → +0.01 | +0.06 | 29.96 |
| Philadelphia | 29.94 inHg · 1014 hPa | normal | ↓ −0.06 | −0.25 | 29.88 |
| San Francisco | 30.10 inHg · 1019 hPa | normal | → +0.02 | +0.06 | 30.14 |
| Dallas | 29.89 inHg · 1012 hPa | normal | → −0.01 | −0.06 | 30.06 |
| Washington, D.C. | 29.92 inHg · 1013 hPa | normal | ↓ −0.06 | −0.26 | 29.90 |
| Atlanta | 29.85 inHg · 1011 hPa | normal | ↓ −0.04 | −0.17 | 29.90 |
| Boston | 29.96 inHg · 1015 hPa | normal | → −0.02 | −0.18 | 29.87 |
| Miami | 29.85 inHg · 1011 hPa | normal | ↓ −0.06 | −0.08 | 29.90 |
| Seattle | 30.08 inHg · 1019 hPa | normal | → +0.02 | −0.01 | 30.17 |
| Detroit | 29.71 inHg · 1006 hPa | low | ↑ +0.05 | −0.19 | 29.88 |
| Denver | 30.08 inHg · 1019 hPa | normal | ↑ +0.05 | +0.09 | 30.10 |
| Tampa | 29.90 inHg · 1012 hPa | normal | ↓ −0.05 | −0.07 | 29.93 |
Data for 3 AM Eastern Time. Sea-level pressure in inches of mercury (inHg), with hectopascals (hPa) alongside. “3 h” and “24 h”: change since 3 and 24 hours ago (inHg); “Tomorrow”: forecast for the same time.
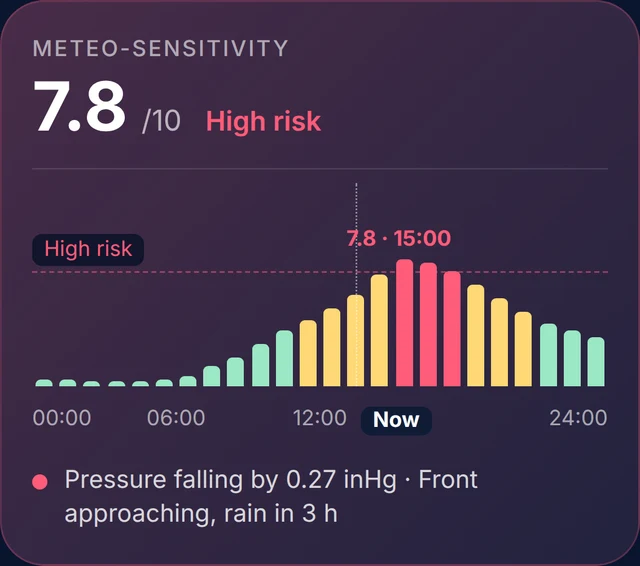
In the Weather24 app
How will the pressure affect you today?
Meteo-sensitivity from 0 to 10, hour by hour, and the “Rapid pressure drop” warning.
Pressure yesterday, today and tomorrow: New York
Hour by hour, at sea level, in inHg. The dashed line is standard pressure (29.92 inHg); the vertical line is now.
High or low pressure: what today’s numbers mean
Standard: 29.92 inHg
That is average sea-level pressure (1013 hPa). Real readings in the US usually stay within about 29.4 to 30.6 inHg, so one number says little on its own: where it is heading, and how fast, matters more.
Highs and lows
Under high pressure air sinks, clouds break up and the weather settles: sunny and warm in summer, frosty nights and fog in winter. Low pressure brings rising air, clouds, rain and wind.
A fast fall means a change
A drop of 0.09 inHg (3 hPa) or more in 3 hours counts as fast: a front with rain and wind is usually on the way. The table marks it with a double arrow ↓↓.
Why your home barometer reads lower
Forecasts give pressure reduced to sea level, so places can be compared. A barometer measures the pressure where it hangs, and that drops with height: about 0.1 inHg every 90 feet. With today’s data, an unadjusted barometer would read roughly:
- Miami (at sea level): about 29.85 inHg · 1011 hPa (at sea level: 29.85 inHg)
- Chicago (about 590 ft): about 29.08 inHg · 985 hPa (at sea level: 29.71 inHg)
- Atlanta (about 1,050 ft): about 28.74 inHg · 973 hPa (at sea level: 29.85 inHg)
- Phoenix (about 1,120 ft): about 28.70 inHg · 972 hPa (at sea level: 29.89 inHg)
- Denver (about 5,280 ft): about 24.76 inHg · 839 hPa (at sea level: 30.08 inHg)
Both numbers are right; they just measure different things. To compare your barometer with the forecast, set it to your city’s sea-level pressure. To spot a change in the weather either works — what counts is how much it rises or falls. Each city page shows the pressure at the city’s own height according to the model.
Air pressure and how you feel: what is known
Many people say they can feel the weather change: headaches, tiredness, aching joints or low mood. Studies on migraine and joint pain link these complaints more to changes in pressure — especially a fast fall ahead of a front — than to the value itself, although the results are mixed and everyone reacts differently.
That is why, as well as the reading, we show the change over the last 3 hours and the last 24. If you keep a diary of how you feel, those are the two numbers worth writing down. How the app scores weather load hour by hour: migraine and arthritis weather forecast.
This is weather information, not medical advice. If your symptoms are severe or new, talk to your doctor.
Barometric pressure in the Weather24 app
- “Pressure” card on the Today screen: the reading where you are now and its level.
- “Pressure over the day”: a 24-hour chart with the standard-pressure line, the low point and the trend.
- “Rapid pressure drop” warning card in the app: when pressure is set to fall by more than 0.44 inHg (15 hPa) before the end of the day.
- “Pressure” map layer with highs and lows over North America.
- “Pressure reference” in settings: Local, the pressure at your height, like a barometer, or Sea level, like forecasts and this page. Units: inHg (the default in the US), hPa or mmHg.
- “Meteo-sensitivity”: a 0–10 score, hour by hour, with the reasons — pressure change, humidity, wind, temperature swings.
Barometric pressure where you are
Pressure right now, how it changes over the day, the rapid-drop warning and meteo-sensitivity — in the Weather24 app.
Frequently asked questions
What is the barometric pressure today?
What is normal barometric pressure?
Is the air pressure high or low today?
Why does my barometer read lower?
What is the barometric pressure near me?
What will the pressure be tomorrow?
Where does the data come from?
See also: rain radar · lightning map · UV index today · best barometric pressure for fishing